
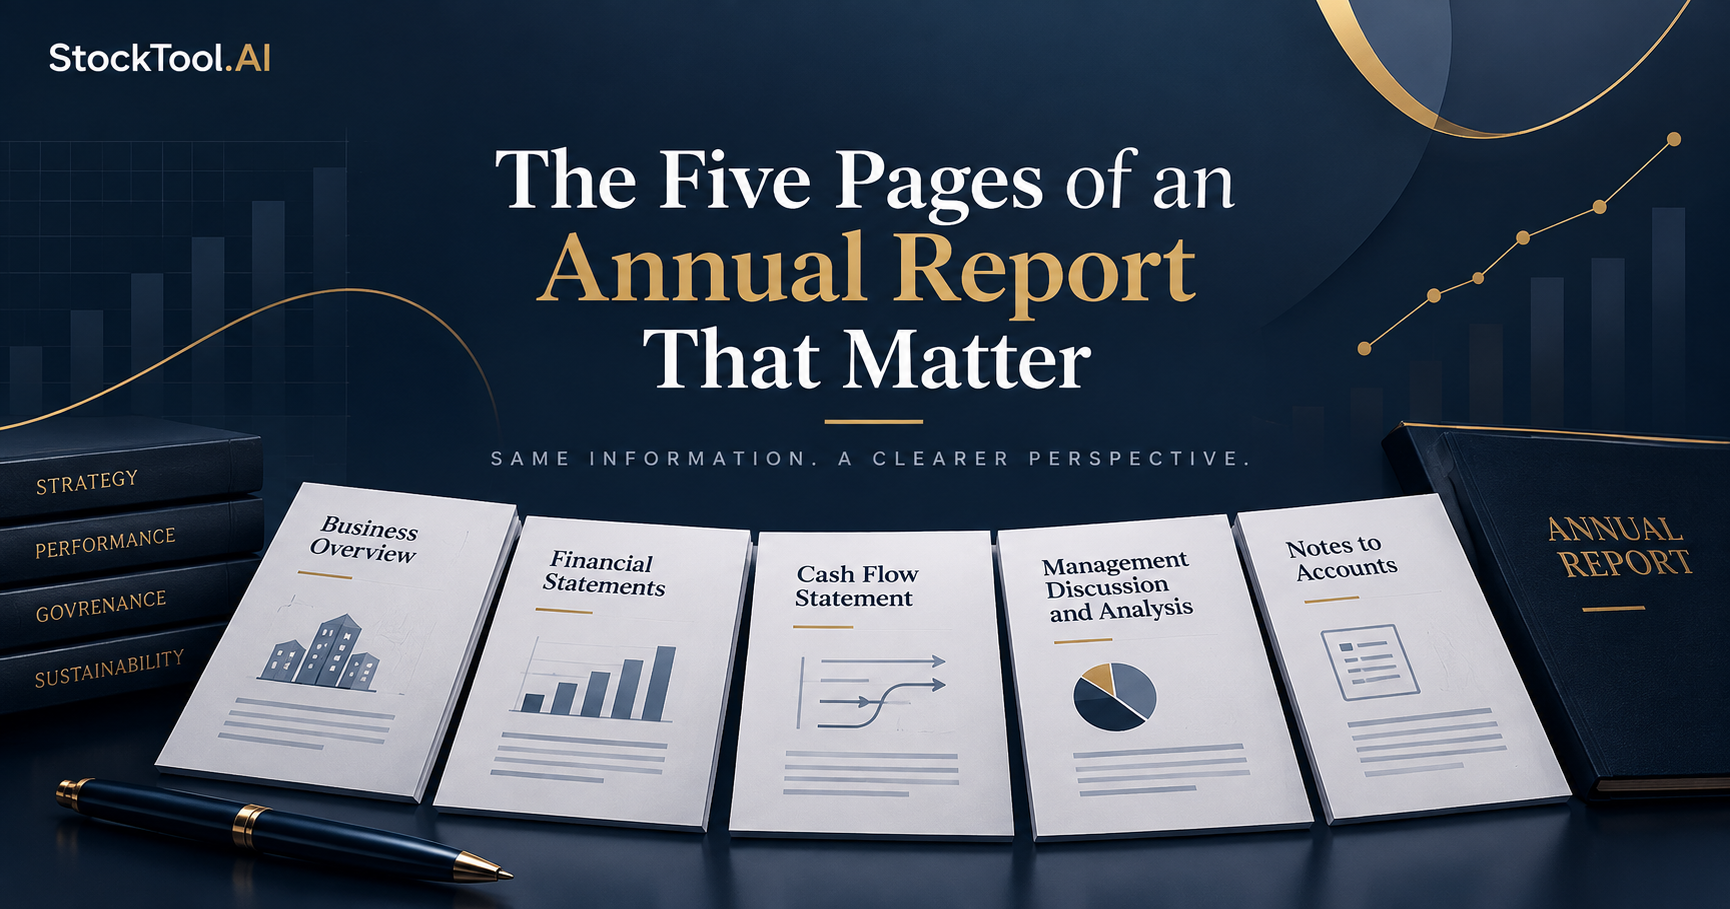
Five sections carry most of what a first read needs: the business overview, the financial statements, the cash flow statement, the Management Discussion and Analysis, and the notes to accounts. Read them in that order. This post works all five on one real Indian annual report, where four headline numbers point in three different directions.
An annual report can run to several hundred pages. Almost none of it is written for a first-time reader, and the parts that are tend to sit behind the parts that are not. The five sections below are where a first read earns its time.
Five sections, not the whole method
We have already published the full routine for working through an annual report section by section, including the table of contents, the auditor’s report and the borrowings note. If you want the complete map, start there.
The longer version is here: How to Read an Annual Report Without Reading It All, published 9 September 2026.
This post does something narrower. It takes the five sections that carry the most weight, puts them in the order you should actually read them, and runs all five against a single company so you can see what the method finds.
The company is IndiaMART InterMESH Limited, and the document is its Integrated Annual Report 2025-26. It is a long report from a business most Indian readers have used at least once, which makes it a fair test.
1. Business overview: what the company actually does
Start here, before any number.
The business overview gives you the context you need to read everything that follows. After a few minutes on it you should be able to answer three questions:
- What does the company provide, and to whom?
- Where does the money come from?
- What can help or hurt it that is outside its control?
IndiaMART describes itself around business-to-business discovery, connecting buyers with suppliers across product categories and geographies. Its FY 2025-26 report describes 41 million active buyers and around 220,000 paying suppliers, and it spends a good deal of the narrative on buyer engagement, supplier verification and the quality of enquiries rather than on volume alone.
Source: IndiaMART InterMESH Limited, Integrated Annual Report 2025-26.
That is worth holding on to. A business that charges suppliers a subscription to be found has a revenue line that moves with how many suppliers pay and what they pay, not with how many transactions happen. When you reach the financial statements, you already know which numbers should move together.
2. Financial statements: find out what changed
Now go to the numbers, and take only a handful on the first pass:
- Revenue from operations
- Profit after tax
- Operating margin, or the profit margin the company reports
- Earnings per share
The point is never whether a number is large. It is what the number did, and against what.
A figure on its own is a fact. A figure next to last year’s is information. So write down both years, every time, even when the report only puts one of them in front of you.
On IndiaMART’s own reported basis, consolidated revenue from operations was ₹1,569 crore in FY 2025-26, up 13% on the ₹1,388 crore of the year before. Consolidated profit after tax was ₹475 crore, against ₹551 crore the year before, a fall of about 14%.
Revenue up, profit down, in the same year. That is the kind of thing a single-year figure hides completely, and it is the reason the previous year belongs in your notes.
Finding four numbers and their prior year inside a three-hundred-page PDF is most of the work of a first read. StockTool.AI’s AR Key Takeaways gives you a fast orientation on what a company’s annual report covers, so you can decide which sections deserve your own read.
Get StockTool.AI on Android · on iOS.
3. Cash flow: did the profit turn into cash?
This is the section most first-time readers skip, and it is the one that most often disagrees with the profit line.
A company reports profit after a long list of accounting judgements. Cash is what actually arrived. On a first read, three lines are enough:
- Cash from operating activities, which is cash thrown off by the core business
- Cash from investing activities, which is what was spent on or raised from assets
- Cash from financing activities, which is borrowing, repayment and payments to shareholders
You are not judging the company on one line. You are looking for agreement or disagreement between the lines.
IndiaMART generated ₹694 crore of cash from operations in FY 2025-26, up about 11% on ₹623 crore the year before. So cash from the business rose while reported profit fell.
That is not a contradiction and it is not an accusation. It is a question, and the annual report is where the answer lives.
4. Management Discussion and Analysis: the reasons offered
The financial statements tell you what happened. The Management Discussion and Analysis, usually shortened to MD&A, is where management tells you why.
Read it after the numbers, never before. If you read it first you will absorb the explanation without knowing what it is explaining.
IndiaMART’s FY 2025-26 report discusses buyer engagement, supplier quality and the use of AI-led capabilities across the marketplace, including tooling built to handle roughly 98,000 product categories. Read next to the numbers, that commentary is about the quality of what the platform sells rather than the quantity.
Then apply the one discipline this section needs. Keep management’s explanation and your own conclusion apart. A sentence in MD&A is what management says happened and what management expects next. It is evidence, and it is not a result.
The test is simple. If management says engagement improved, look for a number that would move if that were true. If management describes investment in technology, look for it in the expense lines. If it describes a difficult year, look for it in revenue, margin or cash.
5. Notes to accounts: where you go when the lines disagree
The notes are the longest part of the report and the part nobody reads front to back. You should not try. The notes are not a section you read. They are a section you search, and the main financial statements tell you what to search for.
Which brings the four IndiaMART numbers together. Set them side by side and they do not all point the same way.
| Consolidated, ₹ crore | FY 2024-25 | FY 2025-26 | Change |
|---|---|---|---|
| Revenue from operations | 1,388 | 1,569 | up 13% |
| Profit after tax | 551 | 475 | down 14% |
| Cash generated from operations | 623 | 694 | up 11% |
| Deferred revenue at year end | 1,678 | 1,965 | up 17% |
Source: FY 2025-26 figures from IndiaMART’s Integrated Annual Report 2025-26 and its Q4 and FY26 results announcement of 30 April 2026. FY 2024-25 figures from its Q4 and FY25 results announcement of 29 April 2025. The annual report states revenue, profit and operating cash flow in ₹ million; they are shown here in crore. Figures are as reported by the company.
Three lines rose. One fell. Revenue grew, cash from operations grew, and deferred revenue, which is money already collected from suppliers for service not yet delivered, grew faster than either. Reported profit went the other way.
That gap is exactly what the notes exist for. A reader who noticed it would go looking for the tax note, the other-income note, any exceptional or one-off item, and the note on employee expenses, in that order, because those are the usual places a profit line moves without the revenue line moving with it.
We are deliberately not telling you what the answer is. Finding the four numbers took ten minutes. Finding the reason is the reader’s own work, and it is the work the notes were written to support.
That is the whole argument for the five-section method. It is not a shortcut to a conclusion. It is the fastest way to arrive at a question worth asking, with the document that answers it already open.
Do not read the annual report on its own
An annual report is one disclosure among several, and it is the slowest of them. By the time it is published, two or three quarters of results have usually been filed since the year it describes ended.
So when something in the report matters to you, check whether the same subject appears in the quarterly results, the investor presentation, the exchange filings or the earnings call transcript. That is how you tell a one-year event from a trend, and how you find out whether management said the same thing twice.
We ran the same exercise on an earnings call rather than an annual report in our earlier piece on the IndiaMART Q1 FY27 concall. The method is the same shape: establish what changed, find the explanation on offer, and go back to the document when something does not fit.
The order to read them in
| # | Section | What you are there for |
|---|---|---|
| 1 | Business overview | What the company sells, to whom, and what moves its revenue |
| 2 | Financial statements | What changed, with the previous year written down beside it |
| 3 | Cash flow statement | Whether the reported profit shows up as cash |
| 4 | MD&A | The explanation management offers, kept separate from your own |
| 5 | Notes to accounts | The detail behind whichever number did not fit |
The auditor’s report, the corporate governance section, the risk disclosures and the related-party note are all worth reading. They are not worth reading first, on a company you are meeting for the first time, before you know what the numbers did.
The short version
You do not read an annual report from page one. You read five sections in order, and you write down the previous year next to every number you take.
Business overview for what the company does. Financial statements for what changed. Cash flow for whether the profit was real cash. MD&A for the explanation on offer. Notes to accounts for the one line that did not fit the others.
On IndiaMART’s FY 2025-26 report, that routine takes about twenty minutes and ends with a specific question: revenue, cash and deferred revenue all grew, and reported profit did not.
Twenty minutes that produce a real question beat two hours that produce a summary.
Disclaimer
StockTool.AI is a research and information platform. It is not a SEBI-registered investment adviser or research analyst, and nothing here constitutes investment advice or a recommendation to buy, sell or hold any security.
Information discussed in this article is for educational purposes. Always verify important information against the original company disclosures and source documents before making any investment decision.
Investments in securities markets are subject to market risks. Read all related documents carefully before investing.