
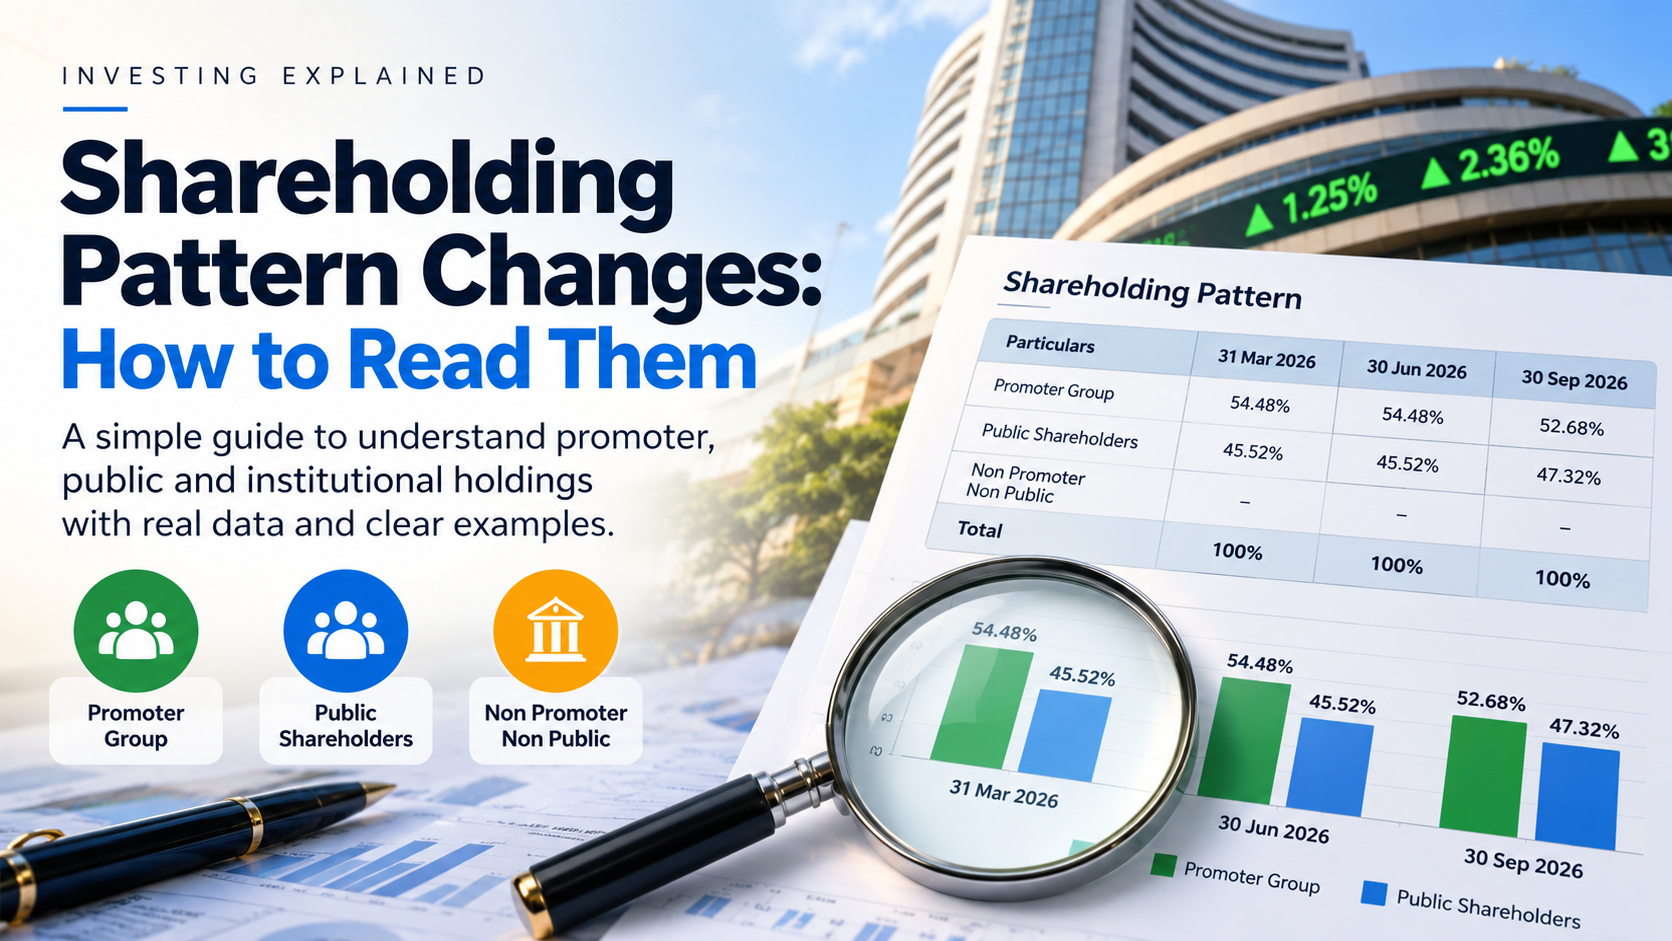
A shareholding pattern is the statement a listed company files with the stock exchanges within 21 days of each quarter-end, showing who holds its shares. To read a change, compare the number of shares held, not only the percentage, check the total number of shares, then find the announcement that explains it. Sun Pharma’s last three patterns show how.
Technical terms are explained where they first appear. Promoters are the people or companies that founded or control a business. The promoter group is their relatives and connected companies and trusts, as the regulations define it. Everyone else is the public. The example is Sun Pharmaceutical Industries Limited, read from its patterns for the quarters ended 31 March, 30 June and 30 September 2026 and from its own announcements.
What the pattern contains, and when it is due
Regulation 31 of SEBI’s Listing Obligations and Disclosure Requirements Regulations (LODR) says the statement is due within twenty-one days of the end of each quarter, so the pattern for the quarter to 30 September was due by 21 October. It is also due within ten days of any capital restructuring that changes the total paid-up share capital by more than 2%. Paid-up share capital is the value of the shares a company has issued and been paid for. Each pattern is a snapshot at its as-on date, the last day of the quarter.
The pattern sorts holders into three categories: Promoter and Promoter Group; Public; and Non Promoter Non Public, for holdings that are neither, such as shares behind depository receipts (certificates, issued abroad, that stand for shares in an Indian company) and shares held by employee benefit trusts. Sun Pharma’s Non Promoter Non Public table is empty in its September pattern, so this post leaves it aside.
Two rules decide what you can see by name. Promoter group holders are listed one by one, with a column for pledged shares. A pledge is shares given to a lender as security for a loan; the filing treats it as one form of an encumbered holding. Public holders are named only above a line: SEBI’s format circular of 30 November 2015 requires names for shareholders holding “1% or more than 1% of shares”. Smaller holders are counted in the totals but not named. NSE’s shareholding pattern page lists the filings by company. Before comparing two patterns, confirm the as-on date and whether a revised filing replaced the first.
Four checks, run on Sun Pharma’s last three patterns
| 31 Mar 2026 | 30 Jun 2026 | 30 Sep 2026 | |
|---|---|---|---|
| Promoter group holding, % of total shares | 54.48% | 54.48% | 52.68% |
| Promoter group shares | 1,307,119,535 | 1,307,119,535 | 1,263,944,164 |
| Promoter group holders | 14 | 14 | 12 |
| Public shares | 1,092,215,435 | 1,092,215,435 | 1,135,390,806 |
| Total shares | 2,399,334,970 | 2,399,334,970 | 2,399,334,970 |
| Promoter shares pledged | 18,525,000 | 21,524,530 | 85,000 |
Source: Sun Pharmaceutical Industries Limited, shareholding patterns under Regulation 31 for the quarters ended 31 March, 30 June and 30 September 2026, Tables I and II (the first two as filed XBRL data files, the September one as the PDF, pages 2 and 3). Holder counts are as the filings print them.
1. The promoter percentage, and the shares behind it
The promoter group’s holding fell from 54.48% to 52.68%, a fall of 1.80 percentage points. A percentage point is the gap between two percentages. The fall is about 3.3% of the earlier holding, a different number, so write 1.80 percentage points. Then look at the shares: 1,307,119,535 in June, 1,263,944,164 in September, which is 43,175,371 fewer, held by 12 promoter group holders against 14.
The quicker, promoter-only version of this check is in our five-minute promoter shareholding check.
2. The denominator
The denominator is the total number of shares a percentage is measured against. When a company issues new shares, every existing holder’s percentage falls although nobody sold; that is dilution. Sun Pharma’s total was 2,399,334,970 in all three patterns, so dilution is not the cause. The public holding rose by exactly 43,175,371 shares, the amount the promoter group lost. The shares changed category. The pattern shows where they sit now, not how they got there.
3. The names
Compare the promoter table line by line. In March and June it named Sudhir Vrundavandas Valia, with 14,345,019 shares, and Raksha Sudhir Valia, with 28,830,352. Together that is 43,175,371 shares, the exact amount that left. Neither appears in the September promoter table. Raksha Sudhir Valia now appears in the public table, which names her because her 1.20% is above the 1% line. Sudhir Vrundavandas Valia’s 0.60% is below the line, so the public table would not name him whichever category his shares sit in.
| Holder, % of total shares | 31 Mar 2026 | 30 Jun 2026 | 30 Sep 2026 |
|---|---|---|---|
| Raksha Sudhir Valia | Promoter table, 1.20 | Promoter table, 1.20 | Public table, 1.20 |
| Life Insurance Corporation of India | 5.23 | 5.53 | 5.32 |
| ICICI Prudential Value Fund | 3.72 | 3.72 | 3.21 |
| Government Pension Fund Global | 1.06 | 1.03 | 1.01 |
| HDFC Trustee Company Ltd. A/C HDFC Balanced | Not named | Not named | 1.14 |
Source: Sun Pharmaceutical Industries Limited, shareholding patterns for the quarters ended 31 March, 30 June and 30 September 2026, Tables II and III (September: pages 3 to 5). Public holders are those named at 1% or more in each pattern.
The 1% line changes what a name means. A holder missing from the list is below 1%, not necessarily gone: the HDFC fund is named only in September, so, as reported, it was below the line before. The pension fund holder at 1.01% sits just above it; if it falls below 1% in a later quarter its name will leave the list, which would show a smaller holding, not an exit.
4. The pledged shares
The pledged figure fell from 21,524,530 shares in June to 85,000 in September. Read as a headline, that is a pledge almost cleared. Read the table: in June, 21,439,530 of the 21,524,530 pledged shares sat with one of the two holders who moved, and the other 85,000 are unchanged across all three patterns. Only promoter group holders report pledges, so September’s figure falls because that holder left the promoter table. The public table does not say whether the pledge continues. A lower pledged number here is not evidence that a loan was repaid.
Then find the reason outside the pattern
The pattern shows what moved. Sun Pharma’s own announcements say why. On 22 May 2026 its board approved requests from “certain promoter group individuals” to move from the promoter group to the public category, “subject to receipt of necessary approvals” under Regulation 31A of the LODR, the rule that sets the conditions for such a move. The postal ballot notice of 25 August 2026 names three applicants: Sudhir Vrundavandas Valia (0.60%), Raksha Sudhir Valia (1.20%) and Krishna Vrundavandas Valia, who held no shares, together 43,175,371 shares, or 1.80%. That is the figure in the pattern. Voting closed on 26 September, and a company filing of 28 September says the resolution “has been duly approved by the shareholders by the requisite majority”.
So the 1.80-point fall is a change of category that shareholders approved, not a sale by the group. The pattern alone could not tell you that. None of these documents says anything about the promoters’ view of the company, and neither does this post.
If no announcement explains a move, record it as unexplained. Do not guess a reason.
Keep a comparison sheet
| What to record | Where in the pattern | Why it matters |
|---|---|---|
| As-on date and filing version | Top of the filing | Confirms the two patterns are comparable |
| Promoter group percentage and share count | Tables I and II | Shows the direction and size of a change |
| Total shares | Table I | Separates dilution from a transfer |
| Promoter group holders, by name | Table II | Shows which holder moved |
| Public holders at 1% or more | Table III | Shows holders crossing the 1% line |
| Pledged promoter shares, by holder | Table II, pledged columns | Tracks the pledge apart from the percentage |
| The announcement behind a move | Exchange announcements near the dates | Gives the reason |
Method: our own, from the four checks above.
Running these checks on one company takes an evening. Running them on every company you follow, every quarter, is the point where most people stop. BSE publishes the filing. StockTool.AI’s plain-English summary is live one minute later, with the original source available for verification. See the Shareholding Changes module on the StockTool.AI features page.
What a shareholding pattern cannot tell you
A pattern records who held what on one date. It does not give a motive, it is not a live record of trading, and it does not replace the financial statements or the announcements. A fall in promoter holding is not automatically a warning sign, and a rise is not a guarantee of anything. Sun Pharma is a worked example of the method, not a view on the company.
The habit is three words: compare, explain, verify. The pattern shows what moved. The surrounding filings show why.
Disclaimer
StockTool.AI is a research and information platform and is not a SEBI-registered investment adviser or research analyst. Its AI-generated insights are based on public filings, transcripts, annual reports and other publicly available information. Summaries may not be exhaustive or error-free, and the original source document should always be treated as authoritative. Nothing here is investment advice or a recommendation to buy, sell or hold any security. Any decision taken on the basis of this information is the reader’s own. Investments in securities are subject to market risks.