
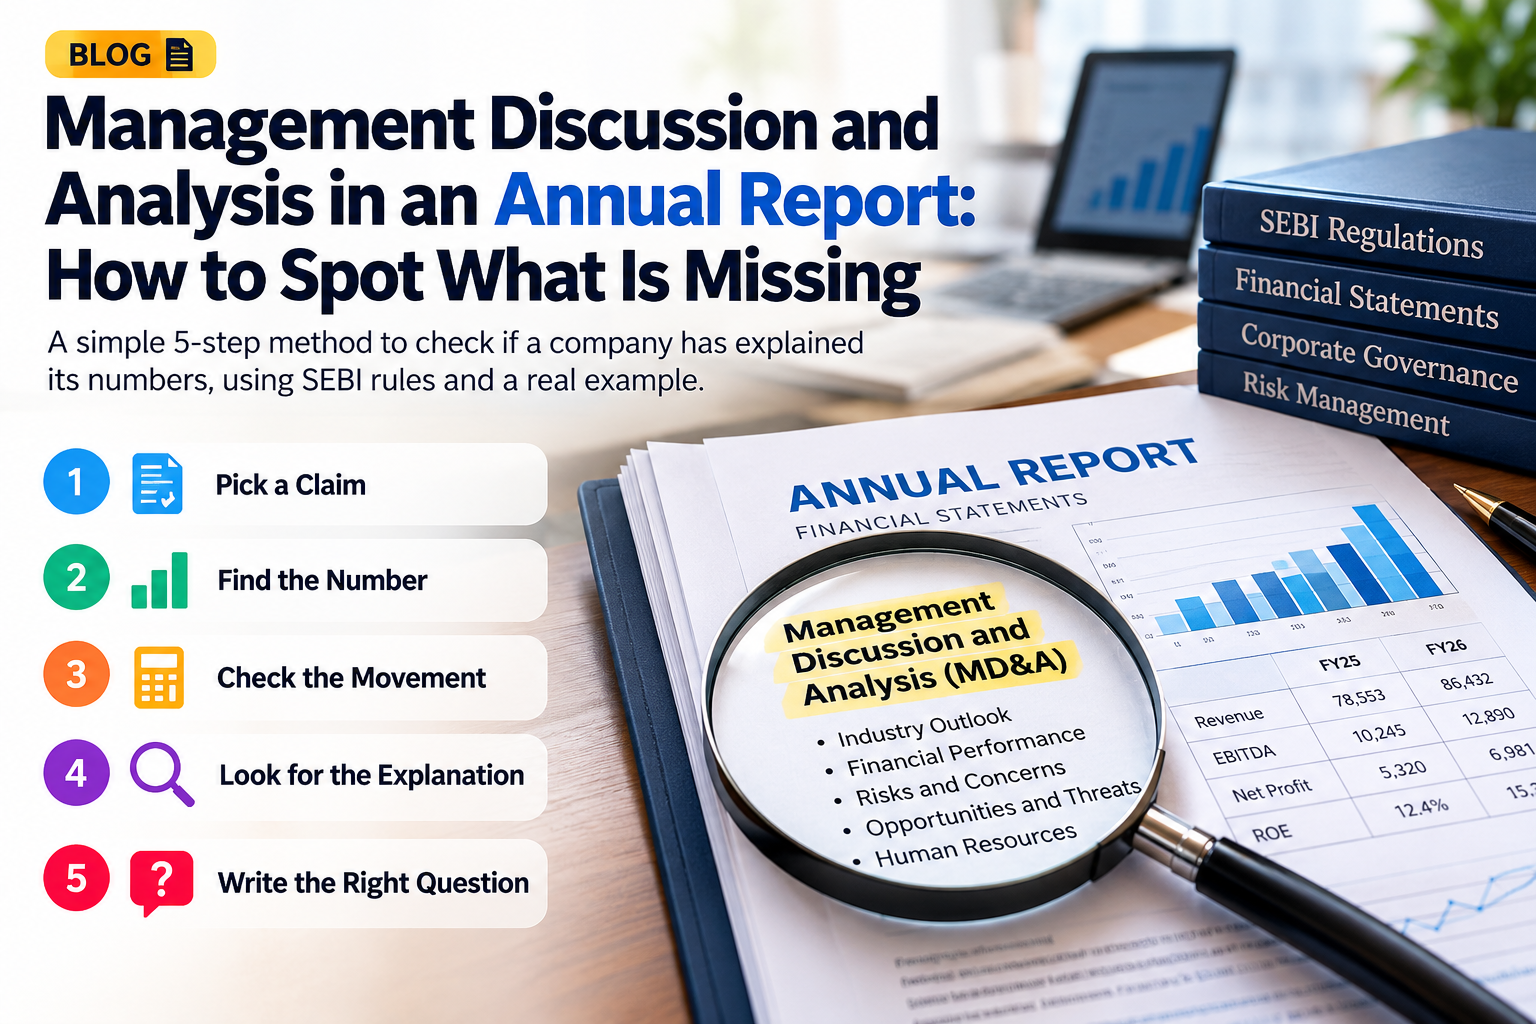
The management discussion and analysis is the part of an annual report where a company explains its own numbers. Some of those explanations are required: SEBI’s rules ask for a reason whenever a key ratio moves 25% or more. To spot what is missing, take one claim, find the number behind it, and check whether the report explains the change.
A gap is a question, not a finding. Companies may keep some detail back for competitive reasons, and some matters are explained in another section. The method below is for deciding which gaps deserve a question.
What the management discussion has to explain
Regulation 34(2)(e) of the SEBI Listing Regulations puts the management discussion and analysis in the annual report, “either as a part of directors report or addition thereto”. Schedule V, Part B then lists what it must discuss, within the limits set by the company’s competitive position: industry structure and developments, opportunities and threats, segment-wise or product-wise performance, outlook, risks and concerns, internal control systems, financial performance in relation to operational performance, and developments in human resources.
Two further items work differently. They come with a number attached.
| Schedule V, Part B | What the company must give |
|---|---|
| Para 1(i): debtors turnover, inventory turnover, interest coverage, current ratio, debt equity, operating profit margin, net profit margin, or sector-specific equivalents | Details of any change of 25% or more against the previous year, with detailed explanations |
| Para 1(j): return on net worth | Details of any change against the previous year, with a detailed explanation. There is no 25% threshold |
Source: SEBI (Listing Obligations and Disclosure Requirements) Regulations, 2015, amended up to 22 January 2026, Schedule V, Part B, paragraph 1(i) and (j).
The topics are open: a topic can be covered in a sentence or in a page, and the rule does not say which. The ratio items are different. A ratio that moved 25% has an explanation beside it, or it does not, and either can be checked in a minute. For what else to read in an annual report, see what to skip and what to keep.
The method in five steps
Reading a management discussion analysis for what it leaves out takes five steps, in this order.
| Step | What to do |
|---|---|
| 1. Claim | Pick one specific statement, such as “profitability improved due to operational efficiency”. An impression such as “management sounds positive” cannot be tested |
| 2. Number | Find the figure behind it in the financial statements, for this year and last |
| 3. Movement | Work out what changed and by how much |
| 4. Explanation | Look for the stated reason in the management discussion, then in the notes |
| 5. Question | Write the open point as a specific question. “Why did receivables grow more slowly than revenue?” is useful. “Is the company hiding something?” is not |
Method: our own. The ratios to look at first are the seven on Schedule V’s list.
Five absences, tested on one report
To show the method working, we ran it on Mahindra & Mahindra’s Integrated Annual Report 2025-26, which the company publishes on its own site. This is not a view of the company. Every statement below is the report’s own, or our arithmetic on its figures, with the printed page where you can check it.
The ratio table on page 185 is the place to start, because it is where Schedule V’s test can be read off.
| Ratio | FY26 | FY25 | Change | Explained in the discussion? |
|---|---|---|---|---|
| Debtors turnover (times) | 23.4 | 22.2 | +5.4% | Not required |
| Inventory turnover (times) | 10.7 | 8.6 | +24.4% | Not required, just under 25% |
| Interest coverage (times) | 77.8 | 62.0 | +25.5% | Yes |
| Current ratio (times) | 1.5 | 1.5 | 0.0% | Not required |
| Debt equity (times) | 0.01 | 0.02 | -50.0% | Yes |
| Operating profit margin | 15.2% | 15.5% | -0.3 points | Not required |
| Net profit margin | 10.6% | 10.0% | +0.6 points | Not required |
| Return on equity | 23.0% | 20.8% | +2.2 points | No separate explanation found |
Source: Mahindra & Mahindra Limited, Integrated Annual Report 2025-26, Management Discussion and Analysis, page 185. Change is our arithmetic on the printed figures.
1. Revenue grows, but the explanation stops at demand
Revenue can rise because the company sold more, charged more, changed its mix, bought a business or booked income differently. Each says something different about whether the growth lasts.
M&M’s revenue from operations rose 25.0%, from ₹1,16,484 crore to ₹1,45,576 crore (page 183). The discussion on page 184 gives volumes: auto up 17.6% to 9,95,526 vehicles, farm up 23.9% to 5,21,203 tractors. It adds that “higher realisation” also helped, but it does not say how much of the growth came from price or mix. That is an explanation, and a partial one. The follow-up question is specific: how much of the 25.0% is volume?
2. Receivables move, and collection goes unmentioned
Debtors turnover is first on Schedule V’s list for a reason. A company can record a sale before the cash arrives, so receivables and revenue should be read together.
M&M’s trade receivables rose 13.3%, from ₹5,726 crore to ₹6,486 crore, against revenue growth of 25.0%. Page 183 says receivables fell from 5.0% to 4.5% of revenue, “mainly on account of better collection efforts and higher volume”. Debtors turnover moved from 22.2 to 23.4, a change of 5.4%, so no explanation was required, and the report gave one anyway. Had the ratio moved 25% or more, Schedule V would have asked for one next to the table.
3. A business struggles, but the group story stays upbeat
Group results can hide a weak segment, and a segment that is small may not deserve the space.
On page 186 the report records that Mahindra Holidays & Resorts’ profit after tax fell 45.3%, from ₹128 crore to ₹70 crore, and it gives no reason on that page. The fall is ₹58 crore. The group’s profit after tax on page 185 is ₹17,099 crore, so the fall is about 0.3% of it. A 45% drop looks alarming, and in this report it is too small to move the group. Size comes before suspicion.
4. Risk language stays the same while the business changes
Competition, input costs, regulation and currency can appear in the risks section year after year. The section is more useful when it reflects what changed during the year: a new geography, more borrowing, dependence on fewer suppliers.
This is the one step that needs two reports. Put this year’s risks and concerns beside last year’s and look for what is new, what has become more specific and what has dropped out. We did not run it on M&M, because it needs the FY25 report as well. Wording alone proves nothing: a shorter paragraph may mean an issue was resolved.
5. An improvement is described, but the cause is missing
Operating profit margin, net profit margin and return on net worth are all on Schedule V’s list. A movement in any of them can come from costs, prices, mix, capacity use or one-off items, and only some of those last.
M&M’s operating margin went from 15.5% to 15.2% and its net margin from 10.0% to 10.6%, both under the 25% line. The discussion names causes for the pieces. Material costs rose from 72.8% to 75.0% of income, “mainly due to inflation in commodity prices and product mix”. Other expenses fell from 6.9% to 5.8%, which the report attributes to “cost management initiatives and higher revenue base” (page 184). The causes are named but not sized: the report does not say how much of the fall in other expenses came from the initiatives and how much from the larger revenue base.
The return on equity row moved from 20.8% to 23.0%. Schedule V asks for an explanation of any change in return on net worth. The explanation that follows the ratio table covers debt equity and interest coverage, the two ratios that crossed 25%, and in the management discussion we found no separate explanation of the return on equity change. Two cautions apply. M&M calls the ratio return on equity, defined in its note 48 as net profit over average total equity, where Schedule V says return on net worth, and we have treated them as the same measure. And the explanation may sit in a section we did not read. This is a question for the reader, not a finding: where does the report explain a rise of about 2.2 percentage points?
Three checks before you call something missing
Is it explained somewhere else? The notes carry a second set of ratios, under “additional regulatory information”, with its own list and its own explanations. In M&M’s note 48 (page 376), debt service coverage fell 40%, from 50.22 to 30.05, “primarily due to increase in principal repayment of long term borrowings due within one year”. It is not one of Schedule V’s seven, so it is not in the ratio table. A reader who searched only the management discussion would have missed it.
Is the ratio rounded? Debt equity is printed as 0.02 and 0.01, which reads as a 50% fall. Recomputed from the balance sheet (page 313), borrowings of ₹1,056 crore over total equity of ₹74,325 crore give about 0.014, against ₹1,135 crore over ₹61,585 crore, about 0.018, the year before: a fall of roughly 23%. M&M explained it anyway. Inventory turnover shows the other side: 10.7 against 8.6 is a 24.4% rise on the page 185 table and 24.6% on the two-decimal figures in note 48, under 25% either way. When a printed ratio is small or sits near the line, recompute it.
Can you write the gap down without a motive? “The report does not say why return on equity rose” is a note. “Management is leaving something out” cannot be supported by a missing sentence. The Holidays gap above is the reminder: a real absence that did not matter. The same applies to the notes, which hold more than ratios: our guide to contingent liabilities shows a note read the same way.
The management discussion comes once a year. Between annual reports, a company’s explanations reach shareholders through exchange filings: results, board meeting outcomes, clarifications and disclosures of material events. BSE publishes the filing. StockTool.AI’s plain-English summary is live one minute later, with the original source available for verification. The rest of the modules are on the StockTool.AI features page. Get StockTool.AI on Android · on iOS.
A checklist for the next management discussion you read
| Check | What to look for |
|---|---|
| 1. Ratios on Schedule V’s list | Any move of 25% or more has a reason beside it |
| 2. Return on net worth | Any change has a reason, not only a figure |
| 3. Revenue | The drivers: volume, price, mix, an acquisition |
| 4. Receivables | The movement against revenue, and who explains it |
| 5. Segments | Weak parts of the business the group story passes over, and whether they are large enough to matter |
| 6. Risks | What changed since last year’s report |
| 7. Elsewhere and rounding | The notes, and a recomputed ratio near the line |
Source: Schedule V, Part B, paragraph 1(i) and (j); the remaining checks are our method.
What reading for absence gives you
Management tells you what it wants you to understand. A report is useful in proportion to how well it can be tested. Read first for what is explained, then for what is not, then ask whether the gap matters. Often the answer is in the next section. When it is not, you have a specific question and a page number to take to the company.
Disclaimer
StockTool.AI is a research and information platform and is not a SEBI-registered investment adviser or research analyst. Its AI-generated insights are based on public filings, transcripts, annual reports and other publicly available information. Summaries may not be exhaustive or error-free, and the original source document should always be treated as authoritative. Nothing here is investment advice or a recommendation to buy, sell or hold any security. Any decision taken on the basis of this information is the reader’s own. Investments in securities are subject to market risks.