
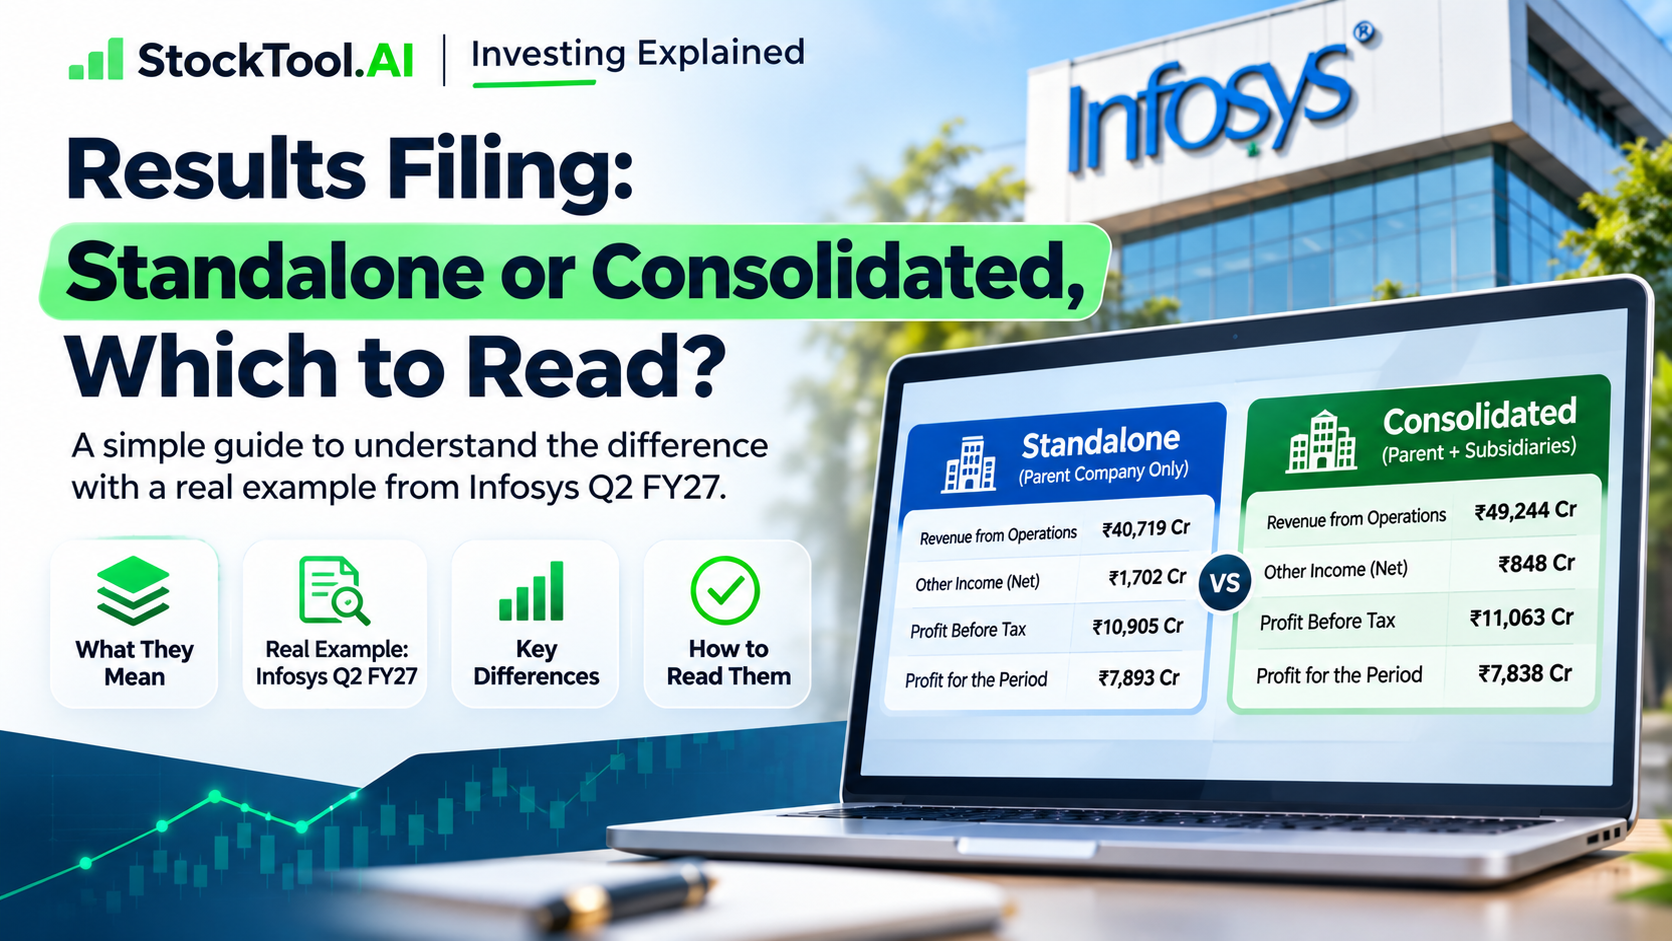
A results filing usually carries two sets of figures. Consolidated results combine the listed company with its subsidiaries; standalone results show the listed company alone. Read consolidated first for the whole business, then standalone for the parent, and only compare consolidated with consolidated and standalone with standalone.
This guide reads both sets in one real filing: Infosys’s results for the quarter ended 30 September 2026, approved by its board on 23 October 2026. Every figure below comes from the filing itself, not from a news report.
What standalone and consolidated mean
Picture a company that runs its main business in India and owns subsidiaries in other countries. Each subsidiary is a separate company with its own revenue, staff and costs. The listed parent can report in two ways.
• Standalone results show the parent as a single legal entity. Its subsidiaries appear only as investments and as any dividends they pay it; their revenue and costs are not added in.
• Consolidated results combine the parent and the subsidiaries it controls as if they were one business. Transactions between companies in the group are removed, so nothing is counted twice.
So the two statements answer different questions. Standalone: how did the parent do on its own? Consolidated: how did the whole group do? Both terms are in our beginner’s glossary of 40 terms.
A real example: Infosys, Q2 FY27
Infosys’s filing carries both statements, audited, prepared under Indian Accounting Standards (Ind AS). For the quarter ended 30 September 2026, in ₹ crore:
| Line in the filing | Standalone | Consolidated |
|---|---|---|
| Revenue from operations | 40,719 | 49,244 |
| Other income, net | 1,702 | 848 |
| Profit before tax | 10,905 | 11,063 |
| Profit for the period | 7,893 | 7,838 |
Source: Infosys Limited, audited financial results for the quarter and half-year ended 30 September 2026, standalone statement (page 16) and consolidated statement (page 12).
Start with revenue. Consolidated revenue is ₹8,525 crore higher than standalone, because it adds the revenue of the subsidiaries. Now look at profit for the period. Consolidated profit, ₹7,838 crore, is lower than standalone profit, ₹7,893 crore. More revenue in the group, less profit. That is not an error.
The filing shows where the difference sits: in other income. The parent’s standalone other income is ₹1,702 crore; the group’s is ₹848 crore. The standalone cash flow statement shows ₹957 crore of dividends received from subsidiaries in the six months to September. In the parent’s own accounts, a dividend from a subsidiary is income. In the group’s accounts it is money moving from one part of the group to another, so it is removed. The filing does not split the quarter’s other income further, so the dividend cannot be read for the quarter alone.
The pattern is not new. A year earlier, in the September 2025 quarter, standalone profit was ₹7,759 crore and consolidated profit ₹7,375 crore.
One more line matters in the consolidated statement. The ₹7,838 crore splits into ₹7,823 crore attributable to the owners of Infosys and ₹15 crore attributable to non-controlling interests: the share of profit that belongs to outside shareholders in some subsidiaries. When a news report quotes Infosys’s profit as ₹7,823 crore, this is the line it is using.
Finally, the filing says the auditors, Deloitte Haskins & Sells LLP, gave an unmodified opinion, which means no qualification. Our guide to what an auditor qualification means in a results filing explains the alternative.
Reading both statements side by side is slow the first time. StockTool.AI’s exchange filing AI summaries help with the first read: BSE publishes the filing, and StockTool.AI’s plain-English summary is live one minute later, with the original source available for verification.
Read past the revenue line
A common mistake in results season is to look at the two revenue figures and treat the larger one as the better performance. The larger figure only reflects a wider scope. To see what is behind it, read these lines in both statements:
• Revenue from operations. Income from the main business. The gap between the two statements shows how much of the business sits in subsidiaries.
• Other income. Interest, dividends and similar income outside the main business. As the Infosys example shows, it can move standalone and consolidated profit in different directions.
• Expenses. A bigger group also carries bigger employee, subcontracting and other costs.
• Profit before tax and profit for the period. Profit before and after tax. In a consolidated statement, check whether a figure is the total or the owners’ share.
• Earnings per share. Profit per share. Standalone and consolidated earnings per share are not interchangeable; compare each only with itself.
What each statement is for
| What you want to understand | Where to start |
|---|---|
| How the whole group performed | Consolidated results |
| How the listed parent performed on its own | Standalone results |
| The parent’s own debts and assets | Standalone balance sheet |
| Which business areas earn the revenue and profit | Consolidated results and segment information |
| Whether subsidiaries are changing the picture | Both sets, and the notes |
Consolidated is the better starting point for most readers, because most listed groups do a large part of their business through subsidiaries. Looking only at the parent can leave out much of what the business does.
Standalone matters when the question is about the parent itself. How much revenue did it earn directly? What does its own balance sheet owe? How much income does it receive from the rest of the group, as in the Infosys example? Those answers matter most when the parent has borrowing of its own, or large investments in subsidiaries.
A consolidated total can also hide differences inside the group. One subsidiary or segment may grow while another shrinks. The segment table and the notes show where revenue and profit come from.
Five checks before you compare the figures
1. The same period.
Quarter on quarter compares the latest quarter with the one before it. Year on year compares it with the same quarter last year. Never compare a three-month figure with a six-month one; results filings show both side by side.
2. The same basis.
Compare standalone with standalone and consolidated with consolidated. Standalone revenue this year against consolidated revenue last year mixes two different scopes.
3. The same units.
Figures may be in rupees, lakhs or crore. Check the heading of each table before comparing.
4. The right profit line.
In a consolidated statement, decide whether you mean total profit or profit attributable to the owners of the parent, and use the same line every time. The same applies to earnings per share, which is calculated on the owners’ share.
5. The notes and the auditor.
The notes explain one-off items, accounting changes and subsidiary details. Check whether the results are audited or only reviewed, and read what the auditor said. For the order to read a whole results day in, see our results day checklist.
If you are not sure which document you have opened, the board meeting outcome is usually where results first appear, and our guide to every common BSE filing type explains the rest.
Read both, but compare like with like
Standalone and consolidated results are not competing versions of the truth. They describe two different scopes of the same business. In Infosys’s case, the group earned more revenue than the parent, and the parent reported more profit than the group, for a reason the filing itself shows.
So do not pick the larger number. Decide which question you are asking, read the statement that answers it, and compare it only with its own earlier periods.
Disclaimer
StockTool.AI is a research and information platform. It is not a SEBI-registered investment adviser or research analyst, and nothing here constitutes investment advice or a recommendation to buy, sell or hold any security.
All insights are AI-generated from publicly available filings, transcripts, annual reports and news. They are summaries, not complete records. They are not exhaustive, and the source document always governs. Information may contain errors or omissions, and data may be delayed or incomplete.
Any investment decision you make is entirely your own. You are responsible for validating every piece of information you rely on against primary sources before acting on it. We accept no liability for any decision taken, or loss incurred, on the basis of anything published here.
Investments in securities markets are subject to market risks. Read all related documents carefully before investing.