
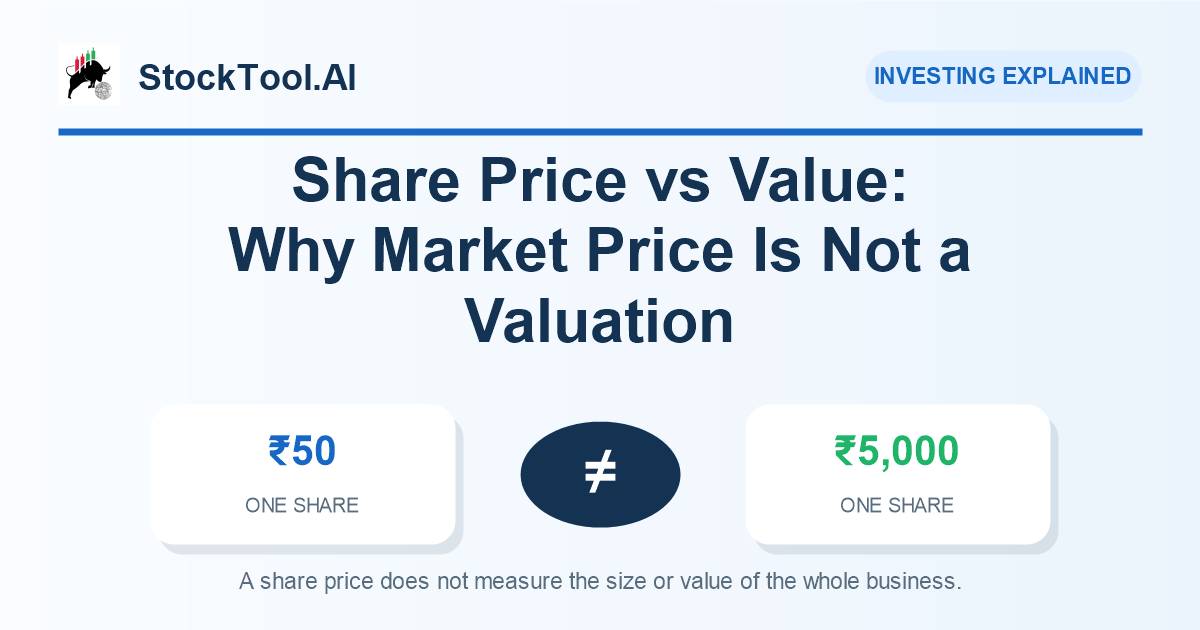
Share price vs value comes down to this: a share price is what one share costs right now. It says nothing about the size or worth of the whole business. A ₹50 share does not mean a smaller company, or a better deal, than a ₹5,000 share. The share count and the company’s results tell you more.
What a share price tells you
A share price is the amount at which one share of a listed company is trading on the exchange at a given moment. If a company’s shares trade at ₹200, five of them come to ₹1,000 at that price, before brokerage and other charges.
That is all the price tells you directly. It does not tell you how large the company is, how many shares it has issued, how much revenue or profit it makes, how much it has borrowed, or whether the price reflects how the business is doing. Comparing two companies by their share prices alone can therefore give the wrong picture: a lower price can look more affordable without the business being smaller, weaker or better value.
Why a ₹50 share can belong to a bigger company than a ₹5,000 share
Take two hypothetical listed companies.
| Company A | Company B | |
|---|---|---|
| Price per share | ₹50 | ₹5,000 |
| Shares outstanding | 100 crore | 1 crore |
| Market capitalisation | ₹5,000 crore | ₹5,000 crore |
Hypothetical figures. Market capitalisation is price per share × shares outstanding.
Company A’s shares trade at a hundredth of Company B’s price, yet the market values the two businesses the same. Now give Company A 200 crore shares instead of 100 crore. At the same ₹50, it is worth ₹10,000 crore, twice Company B, while its share price is still a hundredth of B’s.
The price of one share cannot tell you the size of the company. The number of shares matters just as much.
What market capitalisation is, and how it is calculated
Market capitalisation, or market cap, is the total market value of all of a company’s outstanding shares at a point in time. Outstanding shares are the shares the company has issued and that are held by investors.
A company with 50 crore shares trading at ₹100 has a market capitalisation of ₹5,000 crore. If the price rises to ₹110 and the share count does not change, its market capitalisation becomes ₹5,500 crore.
This is the exchange’s own definition. BSE’s methodology for estimating market capitalisation calculates it by multiplying the current market price of a company’s share by its total outstanding shares.
Market capitalisation gives a broader picture than the price of one share, but it is still a market measure. It shows what investors are paying for the company’s shares today. It does not establish what the business is worth.
Price, market capitalisation and value answer different questions
| Term | What it tells you | What it does not tell you |
|---|---|---|
| Share price | What one share trades at now | How big or how sound the business is |
| Market capitalisation | What the market puts on all the shares together | Whether that figure matches the business underneath |
| Business value | An estimate of what the business is worth, from its finances and prospects | A single number you can read off a share price |
Business value is an estimate, not a quotation. It looks at earnings, cash flows, assets, debt, risks and growth, and different methods give different answers because each rests on assumptions about the future. Two companies can have the same market capitalisation while one makes steady profits with little debt and the other has uneven earnings and heavy borrowing. Their market capitalisations alone would not show you that.
Debt is one reason. Two companies with the same market capitalisation can carry very different borrowings, which is what enterprise value adds to the picture. Our guide to enterprise value shows where the debt and cash figures sit in the annual report.
When the price changes and the company does not
Some corporate actions change the share price without changing the company’s overall value at that moment.
A stock split divides each share into more shares. In India a split is stated by face value, the nominal value printed on each share: a split from ₹10 to ₹5 face value turns every share into two. A share trading at ₹1,000 before such a split would, on the arithmetic alone, trade at ₹500 after it.
A bonus issue gives shareholders extra shares in a fixed ratio. In a 1:1 bonus, a shareholder receives one new share for every share held, and the price adjusts in the same way.
In both cases the price changes because the share count changes; the business is the same business. Prices move afterwards as people trade and react to news, but the split or bonus itself does not make the company more or less valuable. Our post on bonus issue and stock split filings covers what the filing changes on a shareholder’s statement.
What tells you more about a business
If the price is not enough, these are the questions that tell you more. None of them is answered by a share price.
- Revenue and its quality. Revenue is what a company earns from its business before expenses. Is it growing, where does it come from, and does it recur, or did one large contract inflate one quarter?
- Profit. Revenue can rise while profit does not. Operating profit and net profit show what is left after costs, interest and tax. Compare several periods, not one quarter.
- Debt and cash. Borrowing can fund growth, but it brings interest and repayment. Two companies with similar revenue can carry very different risks if one owes much more.
- Assets and liabilities. Assets are what the company owns or controls, such as property, equipment, cash and investments. Liabilities are what it owes. The balance sheet sets them side by side.
- Prospects and risks. Demand, competition, regulation, technology and management decisions all affect what comes next. They are hard to measure, which is why value is an estimate and not an answer.
You find most of these numbers in two documents. The quarterly results filing gives revenue, profit and, twice a year, the balance sheet; read the consolidated figures, as our guide to standalone and consolidated results explains. The annual report adds the full balance sheet, the cash flow statement and the notes; our guide to reading an annual report shows which pages matter.
Results reach the exchange as a filing, often late in the evening. StockTool.AI’s exchange filing AI summaries help with the first read. The exchange publishes the filing. StockTool.AI’s plain-English summary is live one minute later, with the original source available for verification.
Where valuation ratios come in
The next step is a valuation ratio, which sets the price beside something the business produces. The most quoted is the price-to-earnings ratio, or P/E: the share price divided by earnings per share. On its own it is one more number that needs context. Wednesday’s post on the P/E ratio shows where the earnings figure comes from in a results filing, and what the ratio cannot tell you.
Before you compare two share prices
- How many shares are outstanding? Without the share count, a price says nothing about size.
- What is the market capitalisation? Price × shares outstanding: what the market puts on the whole company.
- What do the results show? Revenue, profit and their trend across several periods.
- What does the balance sheet show? Debt, cash, assets and liabilities.
- Has the share count changed? A split or bonus moves the price without changing the business.
A share price is where reading a company starts, not where it ends. If you are new to this, our guide to analysing a stock knowing almost nothing is the place to begin, and terms like market capitalisation and face value are in our beginner’s glossary.
Disclaimer
StockTool.AI is a research and information platform. It is not a SEBI-registered investment adviser or research analyst, and nothing here constitutes investment advice or a recommendation to buy, sell or hold any security.
All insights are AI-generated from publicly available filings, transcripts, annual reports and news. They are summaries, not complete records. They are not exhaustive, and the source document always governs. Information may contain errors or omissions, and data may be delayed or incomplete.
Any investment decision you make is entirely your own. You are responsible for validating every piece of information you rely on against primary sources before acting on it. We accept no liability for any decision taken, or loss incurred, on the basis of anything published here.
Investments in securities markets are subject to market risks. Read all related documents carefully before investing.