
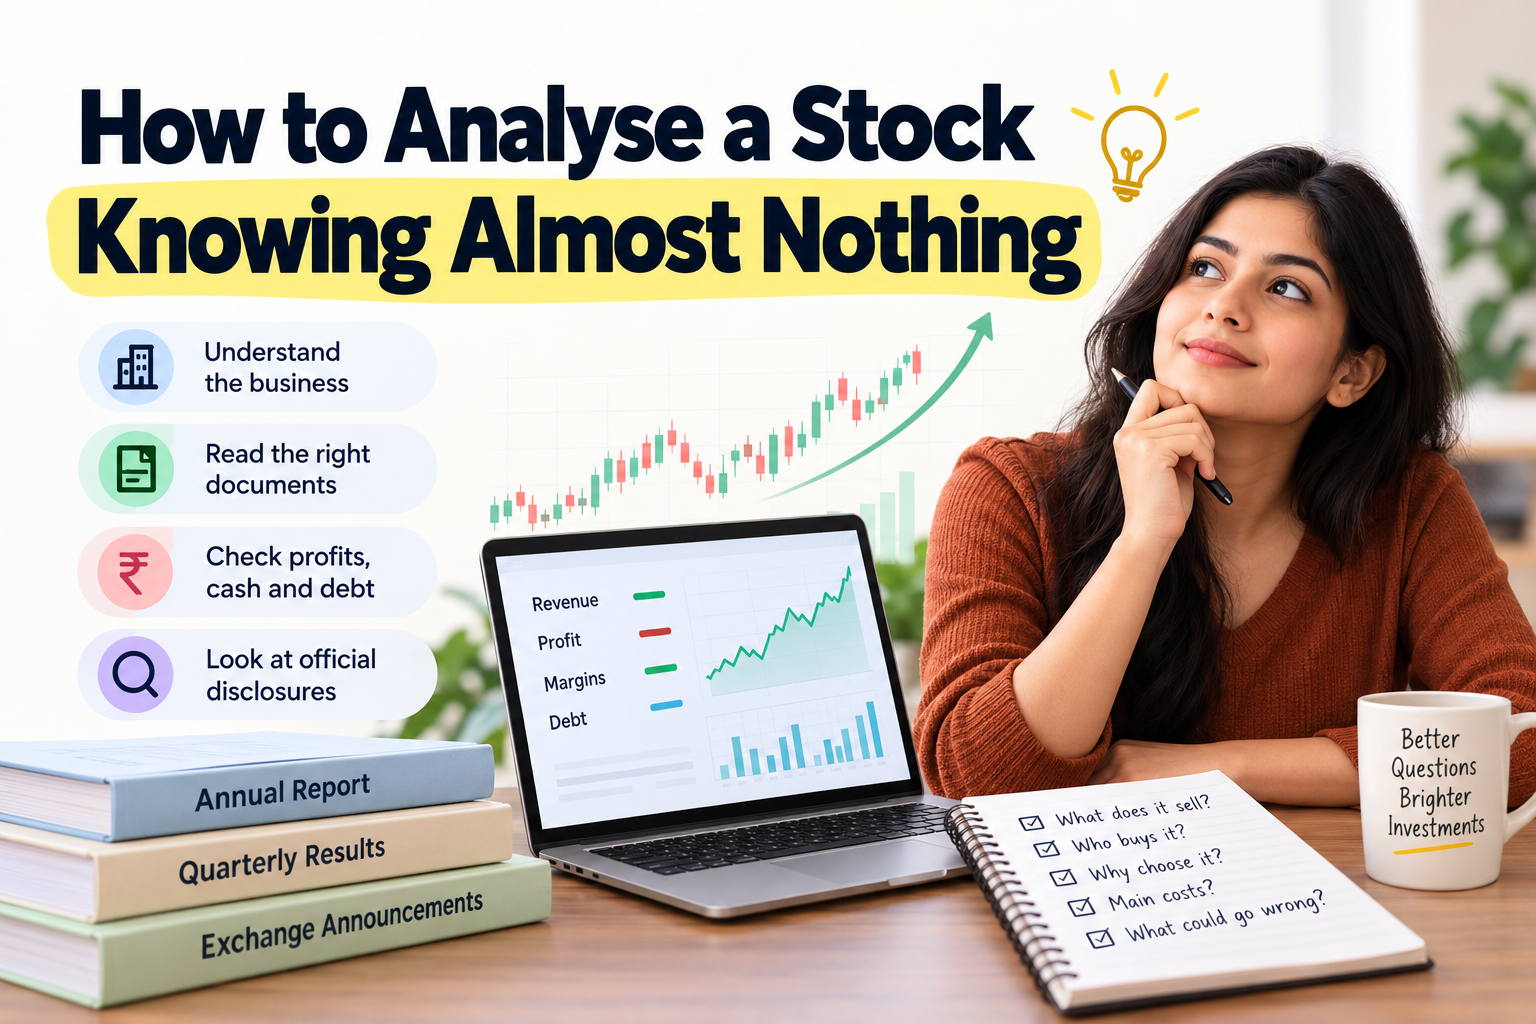
You can analyse a stock without a finance degree. Start with what the business sells and how it earns money. Then check whether its profit turns into cash, how much debt it carries and what its official disclosures say. An annual report, quarterly results and a short list of questions are enough for a useful first assessment.
Most beginners start with the share price or a single profit figure, which tells them the least. The routine below gives you questions to ask of any listed company, and you do not have to master every financial term at once. Each technical term is explained where it first appears.
Start with the business, not the numbers
Imagine opening a company’s annual report for the first time. There are hundreds of pages, unfamiliar terms and tables filled with figures. It is tempting to jump straight to the profit number or the share price. Resist that urge for a moment.
First, answer five basic questions:
- What does the company sell?
- Who pays for its products or services?
- Why do customers choose it over alternatives?
- What are its biggest costs?
- What could make its business weaker?
Suppose you are researching a packaged-food manufacturer. It buys ingredients and packaging, operates factories, distributes products through retailers and earns revenue, the money it takes in from sales, when customers buy. Higher ingredient costs, weaker demand or expensive distribution could squeeze its margins. A margin is the share of revenue left as profit.
You do not need to know the industry inside out to begin. You need a basic explanation of how money moves through the business. The company’s website and annual report are the natural starting points. If you cannot explain what the company does in two or three sentences, spend more time there before moving to ratios, which are one number divided by another.
Find the documents that matter first
You do not have to read everything a company publishes. Start with three sources and understand what each can tell you.
1. The annual report
The annual report brings together the financial statements, the business discussion, risks, governance information and the auditor’s report, which is the independent auditor’s written opinion on the accounts. It shows how the business operates and how management explains its performance. Do not go through every page. Start with the business overview, the financial statements, the cash flow statement, the management discussion and analysis, which is where management explains the year, and the auditor’s report. Our guide, How to Read an Annual Report Without Reading It All, shows how to find each section.
2. Quarterly results
Under Regulation 33 of SEBI’s Listing Regulations (LODR), a listed company must file its results within 45 days of the end of each quarter. The last quarter of the financial year is the exception: it comes with the annual results, within 60 days. A quarter is three months. Quarterly results show what has changed since the previous period. Look at revenue, profit, margins and debt where disclosed, then compare each figure with the same quarter last year. One quarter can be distorted by seasonality, unusual expenses or one-off events, so avoid a firm conclusion from one result alone.
3. Official exchange announcements
Under Regulation 30 of the LODR, a listed company must tell NSE and BSE about listed events, among them an acquisition, a change in senior management and a board decision on raising money, and about other events, such as a new order, when they are material, which means significant enough to matter to investors. Use headlines to discover what happened, then use the original document to see exactly what was disclosed.
This is where you may think, “I wish I could check this for every stock I own.” StockTool.AI’s exchange filing AI summaries do that part: BSE publishes the filing, and StockTool.AI’s plain-English summary is live one minute later, with the original source available for verification.
Learn to read the three financial statements
Financial statements look intimidating, but each answers a different question.
The profit and loss statement: is the business earning money?
It shows revenue, expenses and profit over a reporting period. Profit is what remains after the relevant expenses are accounted for. Consider a fictional company:
| Measure | Year 1 | Year 2 |
|---|---|---|
| Revenue | ₹100 crore | ₹120 crore |
| Expenses | ₹85 crore | ₹105 crore |
| Profit | ₹15 crore | ₹15 crore |
Source: illustrative figures for a fictional company. One crore is 10 million.
Revenue rose 20%, but profit did not grow. That is worth investigating. Perhaps raw materials became more expensive, wages rose or the company spent more to win the extra sales. Growth in revenue alone does not tell you whether the business is becoming more profitable.
The balance sheet: what does the company own and owe?
It shows assets, liabilities and shareholders’ equity at a particular date. Assets include cash, equipment, inventory and receivables, the money customers owe the company. Liabilities include borrowings and amounts payable to suppliers. Shareholders’ equity is what remains for the owners once liabilities are subtracted from assets.
Debt deserves attention because loans must be serviced and repaid. But debt is not automatically a sign of a weak business. What matters is whether borrowing is reasonable for the business and whether the company can meet its obligations. Check whether debt is rising faster than earnings or cash generation, and look at repayment schedules rather than treating the total as the whole story.
The cash flow statement: is profit turning into cash?
It records cash moving into and out of the business, split into operating activities (the day-to-day business), investing activities (buying or selling long-term assets) and financing activities (borrowing, repaying and paying dividends). Operating cash flow is especially useful because it shows whether ordinary operations generate cash.
A business can report accounting profits while customers take longer to pay. If receivables rise sharply and operating cash flow weakens, investigate why. It could be temporary, or reported earnings may not be turning into cash as expected.
Read all three together. The profit and loss statement shows performance, the balance sheet shows financial position, and cash flow shows how cash moves. None provides the full picture alone.
Compare performance instead of judging one number
A number rarely means much without context. Revenue of ₹500 crore may be substantial for one business and modest for another, and a margin that is normal in one industry may be unusual in another. Begin with three comparisons.
Compare the company with itself. Look at several years of revenue, profit, margins, debt and operating cash flow. Is performance improving, weakening or moving unevenly, and is there a clear explanation?
Compare similar businesses. Peers, which are companies in the same industry, face similar demand, input costs and competition. Comparing them shows whether a company’s performance is distinctive or reflects the wider industry.
Compare results with management’s explanation. The concall is the call where management takes analysts’ questions after results, and companies publish a transcript of it. If management says demand is strong, check whether revenue, orders or segment performance support that. If it says costs are under control, look at the expense and margin trends.
Check whether management’s story matches the evidence
Financial figures matter, but so does the way a company governs and communicates.
Start with the auditor’s report. Read the opinion, any qualification and the explanations of significant accounting issues. A qualified opinion is one where the auditor states a reservation about the accounts. It does not automatically establish wrongdoing, but it names an issue you need to understand.
Next, review related-party transactions, which are dealings with parties connected to the company, such as promoters, subsidiaries or other related entities. Promoters are the founders or the group that controls the company. These transactions can be legitimate, but their nature, size, terms and disclosure matter.
Look at changes in promoter shareholding and in pledged shares, which are shares offered to a lender as security for a loan. Changes can have different explanations, so do not treat one movement as proof of either confidence or concern.
Finally, compare management’s claims over time. Has an expansion plan progressed as described? Have promised projects begun contributing revenue? Does the company explain setbacks clearly, or do important questions remain unanswered? You are not trying to prove management good or bad from one document. You are checking whether its explanations stay consistent with the evidence.
Understand valuation without getting lost in formulas
A company can run a sound business and still be priced at a level that leaves little room for disappointment. Business quality and valuation are related, but they are not the same thing.
One commonly discussed measure is the price-to-earnings ratio, or P/E. It compares the share price with earnings per share, which is profit divided by the number of shares. A lower P/E does not automatically mean an opportunity, and a higher P/E does not automatically mean a company is overpriced. The figure may reflect expectations about growth, business risks, cyclical earnings, which rise and fall with the business cycle, or doubts about the quality of reported profit.
For a beginner, the first step is not to calculate a fair value. It is to ask:
- What earnings figure is being used, and is it unusually high or low?
- How does the valuation compare with similar companies?
- Are earnings supported by operating cash flow?
- What expectations about future performance might already be reflected in the price?
If you cannot explain why a valuation measure differs between two companies, pause before drawing conclusions. Understanding the business and the quality of its earnings should come before relying on a ratio.
Turn research into a simple repeatable checklist
Once you understand the basic documents, keep a short record for each company you examine. It makes it easier to revisit your reasoning when the next quarterly result or announcement appears. Your first research note can be as simple as this:
- Business: what does the company sell, and who are its customers?
- Performance: what happened to revenue, profit and margins over the last few reporting periods?
- Cash: is operating cash flow broadly supporting reported profit?
- Debt: how much does the company owe, and when are repayments due?
- Management: do disclosures answer important questions clearly?
- Risks: what could disrupt the business, and where is that risk discussed?
- Valuation: what does the current valuation appear to assume about future performance?
- Next check: which upcoming result, filing or development would help you reassess the picture?
Write down what you know, what you do not know and which source could resolve the gap. Uncertainty is a reason to investigate, not a reason to invent an answer.
You do not need to understand everything on day one
Learning to analyse a stock is not about memorising dozens of ratios or predicting what a share price will do tomorrow. It is about asking better questions and checking the answers against reliable evidence.
Start with the business model. Read the three financial statements. Compare performance over time. Examine debt, cash flow, management disclosures and valuation. Then return to the next set of filings and see what has changed.
When you are ready for more, there is a post on each of these: auditor qualifications, related-party transactions, contingent liabilities (obligations that become payments only if a future event happens), shareholding pattern changes and results day.
The goal is not to become an expert after one annual report. It is to build a research habit that makes each report easier to read, and helps you tell what a company has disclosed from what someone else says it means.
Disclaimer
StockTool.AI is a research and information platform and is not a SEBI-registered investment adviser or research analyst. Its AI-generated insights are based on public filings, transcripts, annual reports and other publicly available information. Summaries may not be exhaustive or error-free, and the original source document should always be treated as authoritative. Nothing here is investment advice or a recommendation to buy, sell or hold any security. Any decision taken on the basis of this information is the reader’s own. Investments in securities are subject to market risks.