
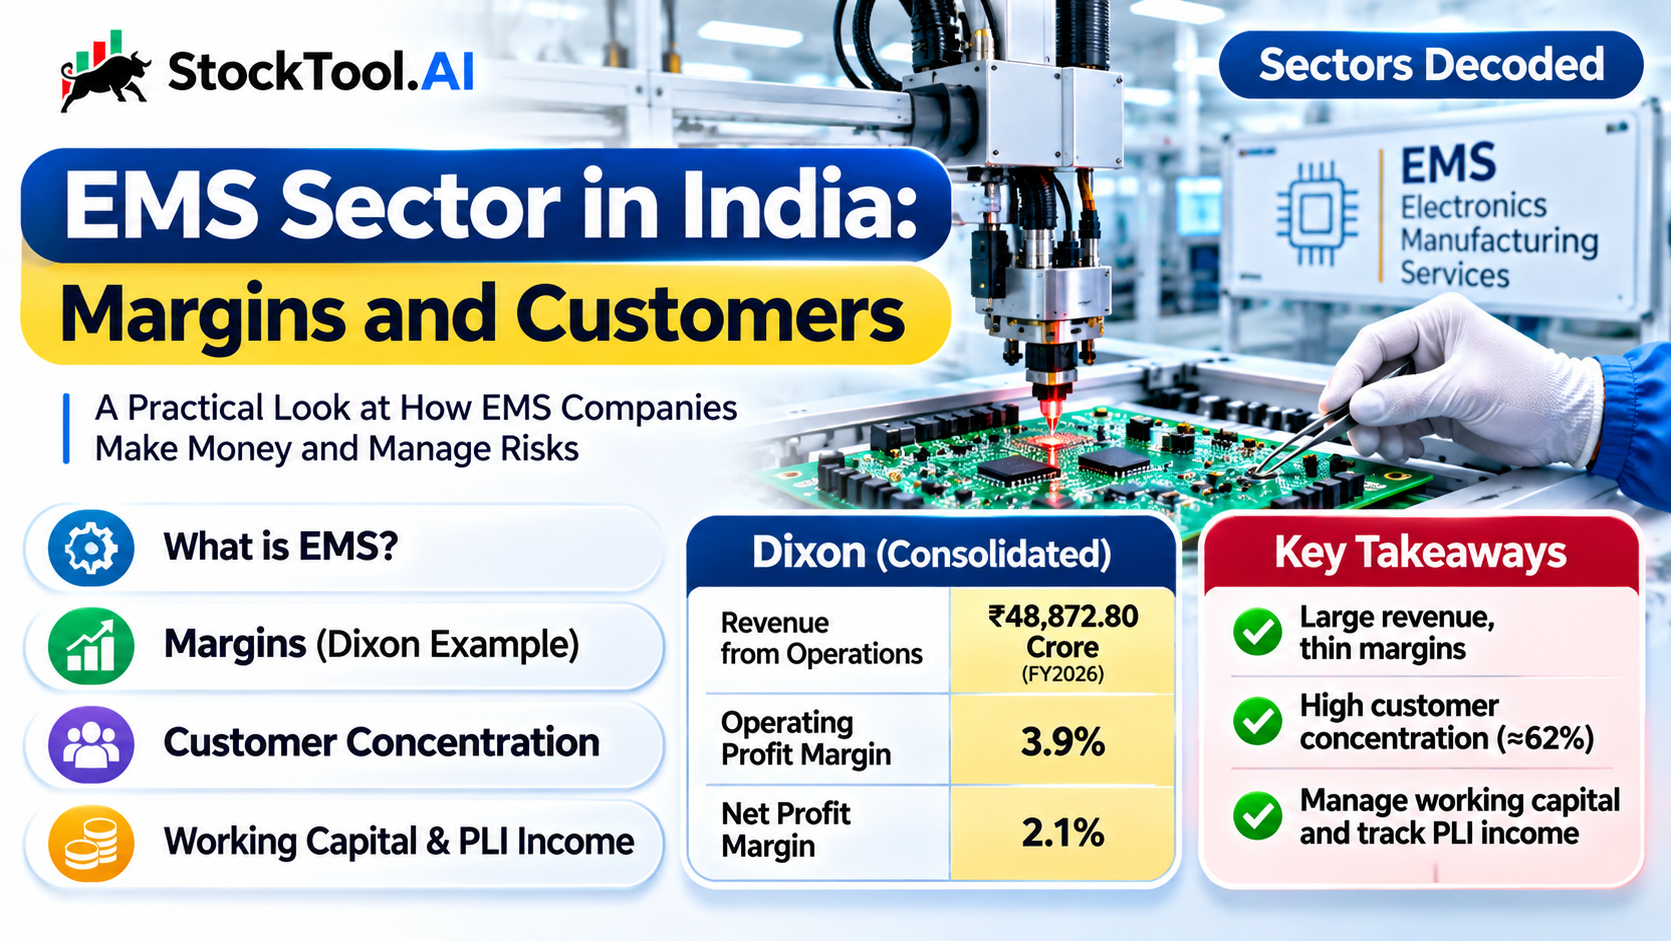
In the EMS sector in India, revenue is large and margins are thin, because an EMS company buys most of the parts it builds into a customer’s product. To read one, check four things in its annual report: how the margin is defined, how much revenue comes from a few customers, working capital, and PLI incentive income.
What an EMS company does, and why its revenue needs a second look
EMS stands for electronics manufacturing services. An EMS company makes electronic products or assemblies for an original equipment manufacturer, or OEM: the brand that owns the product and sells it under its own name. The work runs from printed circuit board assembly, mounting components on a board, to box build, where the board goes into a finished product with its casing and wiring. Some EMS companies also design, test and source parts.
Usually the EMS company buys the components, assembles and tests the product, and invoices the customer for the whole thing. So the invoice carries the value of the parts. Suppose a finished product is invoiced at ₹1,000, of which ₹850 is components and other bought-in material. The remaining ₹150 has to cover labour, testing, overheads and the manufacturer’s return. (These numbers are illustrative.)
The ₹1,000 is revenue, but most of it passes straight through to suppliers. A business that books the full value of the parts in revenue will show a lower margin, as a percentage of sales, than one that earns only a fee. A thin margin is therefore part of the model, not by itself a sign of a weak business. It does make the other lines in the report matter more.
Our post on the semiconductor sector in India looked at the chips that go inside these products. EMS sits one step closer to the finished product.
Margins: what Dixon’s report shows
Take Dixon Technologies (India) Limited, an EMS company serving domestic and global brands in mobile phones, consumer electronics, home appliances, IT hardware and telecom. Its Integrated Annual Report FY2025-26 covers the year to 31 March 2026, FY2026. All figures here are consolidated, for the group as a whole.
| Dixon, consolidated | FY2025 | FY2026 |
|---|---|---|
| Revenue from operations, ₹ crore | 38,860.10 | 48,872.80 |
| Operating profit margin | 3.9% | 3.9% |
| Net profit margin (before non-controlling interests, excluding exceptional items) | 2.2% | 2.1% |
Source: Dixon Technologies, Integrated Annual Report FY2025-26: revenue from operations, note 36, page 457 (reported in ₹ lakh, converted to crore); margins, Financial Overview, page 189.
Read the definitions under the chart before the numbers. Dixon defines operating profit margin as operating profit divided by income from operations, and net profit margin as profit after tax divided by income from operations. A margin of 3.9% means about ₹3.90 of operating profit for every ₹100 of income. Non-controlling interests are the share of subsidiaries’ profit that belongs to their other shareholders; “before” them means the whole group’s profit is counted.
The same page marks its revenue and EBITDA figures as including other income, which is why its headline total income differs from revenue from operations. Compare like with like: a margin that includes other income is not the same measure as one that does not.
Customer concentration: the risk page and the note
Customer concentration is how much of a company’s business depends on a few customers. In EMS it is built into the model: a manufacturer may work with a handful of large brands, each placing orders across product lines. A large customer brings scale; if it changes supplier, delays a launch or cuts volumes, the manufacturer has to adjust.
Dixon’s report says so in its risk section: EMS business models often involve high customer concentration with large OEM partners, and changes by key customers may influence revenue visibility and production planning (page 188).
The risk page describes the exposure. The notes to the accounts measure it. Accounting standards require a company with a single segment to disclose reliance on major customers, and Dixon reports one segment, electronic goods. Its segment note says revenue from three customers was about 62% of total revenue in FY2026, against 60% the year before (note 55, page 487). A separate note on credit risk says three customers account for more than 10% of outstanding trade receivables (page 474).
| What the report says | What it does not say |
|---|---|
| Three customers made up about 62% of revenue (60% a year earlier) | Who the three customers are |
| Three customers account for more than 10% of trade receivables | Each customer’s individual share |
| Customer concentration is a sector risk | How long each customer relationship is contracted for |
Source: Dixon Technologies, Integrated Annual Report FY2025-26: risks, page 188; note 55, page 487; credit risk note, page 474.
So read past the risk section to the notes. A general statement that a company serves many brands is not evidence that its revenue is spread evenly among them, and here the note shows it is not.
Working capital: when does the cash come back?
Working capital is the money tied up in day-to-day operations. An EMS company may pay for components, keep stock and pay its workers before the customer pays. Three measures describe the cycle: inventory days, how long stock is held; debtor days, how long customers take to pay; and creditor days, how long the company takes to pay its suppliers.
| Dixon, FY2026 | Days |
|---|---|
| Inventory days | 33 |
| Debtor days | 52 |
| Creditor days | 93 |
| Net working capital days | (8) |
Source: Dixon Technologies, Integrated Annual Report FY2025-26, “Disciplined Working Capital Management”, pages 60 and 61. Debtor days were 60 and inventory days 32 a year earlier (page 189).
Negative working capital days mean suppliers and customers fund more of the cycle than the company’s own cash does. Dixon attributes its negative cycle to advance customer collections, inventory turnover and supplier partnerships. It is not a feature of every EMS company, and one year-end figure is not a trend: compare several years, and read them beside the cash flow statement.
PLI income: find it in the notes
The Production Linked Incentive, or PLI, schemes pay eligible manufacturers incentives linked to incremental sales and investment. For an EMS company they can add to reported income, so separate them from the margin earned on manufacturing.
Dixon’s overview says the group benefits from five PLI schemes (page 3). Its accounting policy says PLI incentives are recognised as “other operating revenue”, on an accrual basis once the company becomes eligible and there is reasonable assurance the scheme’s conditions are met (page 418). Accrual means the income is recorded when it is earned, before the cash arrives.
Note 36 shows “other incentives including amortisation of deferred payment” of ₹314.04 crore in FY2026, against ₹256.33 crore the year before (page 457). That line is not split by scheme, so it cannot be read as PLI alone.
Note 59(a) gives the larger figure. A subsidiary, Padget Electronics, has accrued ₹1,110.06 crore of PLI incentive for performance above the scheme’s annual ceiling, across several performance years. It remains receivable, pending determination and payment by the scheme’s Project Management Agency, and the subsidiary has recognised a matching liability of ₹726.34 crore payable to its customer under their arrangement (page 499). The auditors draw attention to this note in an emphasis of matter, a paragraph that highlights an item without qualifying the opinion; they state the opinion is not modified (page 399).
Incentive income sits close to other income in many filings; our guide to other income in a results filing shows how to keep it apart from operating profit.
Five questions for the next EMS filing
- Which margin? Operating, EBITDA or net, and does it include other income or exceptional items?
- How concentrated? Find the major-customer note; single-segment companies usually give it there. Our post on segment results explains the segment note.
- How is working capital moving? Inventory, debtor and creditor days, against the cash flow statement.
- How much is incentive income? Read the revenue note and the accounting policy; check whether it is received or still receivable.
- What does the auditor highlight? Any emphasis of matter, and the note it points to.
Between annual reports, the same lines arrive as exchange filings: quarterly results, and disclosures of new customer agreements or scheme approvals. StockTool.AI’s exchange filing AI summaries help with the first read of those. The exchange publishes the filing. StockTool.AI’s plain-English summary is live one minute later, with the original source available for verification. The annual report and its notes still need reading in full.
What the filings can and cannot tell you
Dixon’s report shows how its margins are defined and what they were, that three customers made up about 62% of revenue, how its working capital cycle ran, and how much PLI incentive it has accrued and is still waiting to receive. It does not name the three customers, split its incentive income by scheme, or say when the outstanding incentive will be determined. Those are the gaps to watch in the next filing.
Dixon appears here as a worked example of reading an EMS company’s report, not as a view on the company, its profitability or its outlook. On results day, our results-day checklist puts these lines in reading order, and terms like OEM, EBITDA and working capital are in our beginner’s glossary.
Disclaimer
StockTool.AI is a research and information platform. It is not a SEBI-registered investment adviser or research analyst, and nothing here constitutes investment advice or a recommendation to buy, sell or hold any security.
All insights are AI-generated from publicly available filings, transcripts, annual reports and news. They are summaries, not complete records. They are not exhaustive, and the source document always governs. Information may contain errors or omissions, and data may be delayed or incomplete.
Any investment decision you make is entirely your own. You are responsible for validating every piece of information you rely on against primary sources before acting on it. We accept no liability for any decision taken, or loss incurred, on the basis of anything published here.
Investments in securities markets are subject to market risks. Read all related documents carefully before investing.