
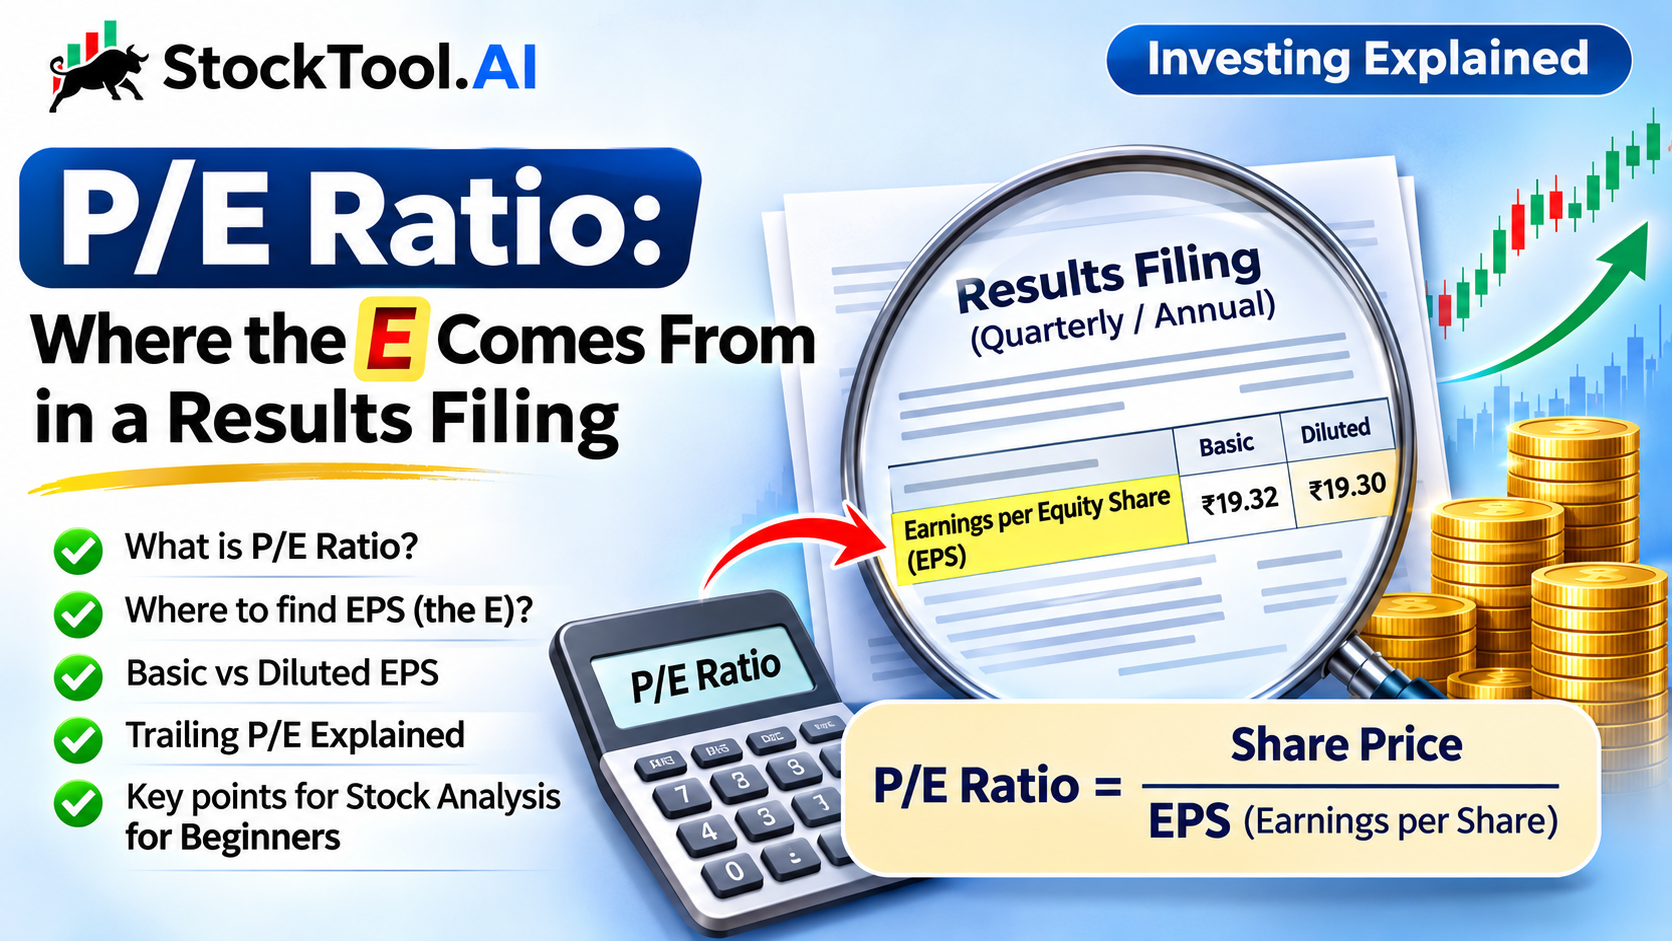
The P/E ratio divides a share price by earnings per share, or EPS. The price comes from the market on a given day. The E comes from the company’s results filing: reported earnings for a stated period, usually the last four quarters. So read the EPS line with its labels: the period, basic or diluted, consolidated or standalone.
What the P/E ratio measures
P/E stands for price to earnings. It sets the market price of one share beside the profit the company earned for each share over a period.
P/E ratio = share price ÷ earnings per share
If a share closes at ₹600 and the company earned ₹20 a share over the last twelve months, the P/E is ₹600 ÷ ₹20 = 30, written 30x. The price is thirty times one year’s earnings per share. (These numbers are illustrative.)
It does not mean you get your money back in thirty years. Profit is not all paid out, earnings change and the price moves. The ratio compares a price with a reported earnings figure, nothing more. The formula is simple; finding the right E takes more care, and the place to find it is the results filing.
Where EPS sits in a results filing
Take Infosys. Its results for the quarter to 30 September 2026 were taken on record by its board on 23 October 2026 and are audited. Near the foot of the consolidated statement, below the profit lines, sits “Earnings per equity share”, in two rows, basic and diluted, for each period the statement shows.
| Infosys, consolidated EPS, ₹ per share | Basic | Diluted |
|---|---|---|
| Quarter to 30 Sep 2026 (Q2 FY27) | 19.32 | 19.30 |
| Quarter to 30 Jun 2026 (Q1 FY27) | 19.19 | 19.17 |
| Quarter to 30 Sep 2025 | 17.76 | 17.74 |
| Six months to 30 Sep 2026 | 38.51 | 38.46 |
| Six months to 30 Sep 2025 | 34.47 | 34.41 |
| Year to 31 Mar 2026 (FY26) | 71.58 | 71.46 |
Source: Infosys, statement of consolidated audited results for the quarter and half-year ended 30 September 2026, Ind AS, page 12 of the filing. The filing notes that quarterly and half-year EPS is “not annualized”.
Read the last line of that note again. A quarter’s EPS is three months of earnings. It is not a yearly figure, and the filing says so.
EPS is not revenue divided by shares. Infosys’s own note on the method says basic EPS is the net profit attributable to the company’s shareholders divided by the weighted average number of shares outstanding in the period. “Attributable” leaves out the share of profit belonging to non-controlling interests, the outside owners of subsidiaries the company does not fully own. For the quarter to June 2026 that was ₹7,769 crore over about 404.8 crore shares, which gives the ₹19.19 in the table (Q1 FY27 consolidated financial statements, page 2; the method is note 2.20).
The average is weighted because the share count moves. Shares issued or bought back part of the way through a period count only for the days they were outstanding. Infosys’s weighted share count for the June 2026 quarter, about 404.8 crore, was lower than the 414.4 crore of a year earlier, so the same profit would give a higher EPS.
Basic EPS and diluted EPS
Basic EPS uses the shares actually outstanding. Diluted EPS also counts the shares that could be issued, for example when employee stock options or restricted stock units are exercised, if counting them lowers EPS. The same profit spread over more shares gives a smaller figure.
In the Infosys quarter the gap is two paise: ₹19.32 basic against ₹19.30 diluted, because its diluted count adds about half a crore shares for stock awards. In companies with large option schemes or convertible bonds the gap can be much wider. Both are defined in Ind AS 33, the accounting standard for earnings per share, listed on the Ministry of Corporate Affairs accounting standards page. If two websites show different P/E figures for the same price, check whether one uses basic EPS and the other diluted.
The quarter’s EPS is not the E
A trailing P/E uses the last four reported quarters, the trailing twelve months or TTM. That is where a quick reading goes wrong.
With the illustrative ₹600 share: if the last four quarters earned ₹4, ₹5, ₹6 and ₹5 a share, trailing EPS is ₹20 and the P/E is 30x. Divide the same price by the latest quarter’s ₹5 alone and you get 120x. Same company, same price, a ratio four times higher, because three months of earnings stand in for twelve.
You can build the trailing figure from the Infosys filing without four separate quarterly reports. Take the year to March 2026, add the six months to September 2026, and take away the six months to September 2025:
₹71.58 + ₹38.51 − ₹34.47 = ₹75.62 basic EPS for the twelve months to September 2026
That is our arithmetic, and close rather than exact, because each period has its own weighted share count; diluted works out at ₹75.51. Against it, the quarter’s ₹19.32 is about a quarter of the year’s earnings, so any price divided by the quarter gives a P/E nearly four times as high. Multiplying the quarter by four gives ₹77.28, which is not the trailing figure either: it assumes every quarter matches the last.
Index providers use the same convention. NSE’s method for index P/E adds up each company’s earnings for the trailing four quarters, from consolidated results, falling back to standalone where consolidated results are not available. Data providers quoting a single company’s P/E may use other conventions, so check which E they use.
Check which profit is behind the EPS line
- Consolidated or standalone. Consolidated results combine the company with its subsidiaries; standalone results cover the listed company alone. Infosys’s standalone basic EPS for the quarter is ₹19.45, against ₹19.32 consolidated, from the same filing (page 16). Use consolidated, and use the same basis for every company you compare.
- Exceptional items. A one-off gain or charge moves EPS for the period it lands in. Infosys’s year to March 2026 carries an exceptional item of ₹1,289 crore, “Impact of Labour Codes”, and the half-year column to September 2025 shows none, so it fell in the second half of that year. The trailing figure above therefore includes it. The filing shows the charge; it does not restate EPS without it, and neither should you.
- Continuing or discontinued operations. If a business has been sold or is being sold, the filing may show EPS for continuing operations separately. Check which one a P/E uses.
Our guides to standalone and consolidated results and exceptional items in a results filing go further on each, and the results-day checklist puts EPS in its reading order.
All of this arrives as one exchange filing, usually within hours of the board meeting. StockTool.AI’s exchange filing AI summaries help with the first read of it. The exchange publishes the filing. StockTool.AI’s plain-English summary is live one minute later, with the original source available for verification.
Why the price comes from a different date
The P is a market price at a moment: a day’s close or the latest trade. The E describes a period that has already ended. A company may file its results on a Thursday evening; the next morning the price moves, the E stays the same, and the P/E changes. Monday’s post on share price and value explains why the price itself says nothing about the size of the business.
So ask two date questions of any P/E you see: which day’s price, and which twelve months of earnings? Websites refresh prices and earnings on different schedules, which is one reason their figures differ.
Where the P/E ratio misleads
- Losses. With negative EPS the ratio has no ordinary meaning. Some sites show “NM”, not meaningful; Nifty’s index method stops publishing an index P/E while index earnings are negative.
- Cycles. Earnings at the top of a business cycle make the P/E look low; at the bottom, high. One year is not the cycle.
- Different businesses. Growth, capital needs and risk differ by industry, so a P/E comparison across unrelated businesses says little.
- Debt. P/E ignores borrowing. Two companies on the same P/E can owe very different amounts, which is what enterprise value adds.
- Expectations. The price reflects what the market expects; the trailing E is what already happened. A P/E, high or low, needs the context above before it means anything.
Our guide to enterprise value shows where the debt and cash figures sit.
Five checks before you use a P/E figure
- Which price? The day and time of the price in the numerator.
- Which period? Trailing four quarters, the last financial year, or a forecast.
- Which EPS? Basic or diluted.
- Which results? Consolidated or standalone.
- Anything unusual? Exceptional items or discontinued operations inside the period.
If a site does not say, open the results filing and find the line yourself. If you are new to this, start with our guide to analysing a stock knowing almost nothing; terms like EPS and diluted are in our beginner’s glossary.
Disclaimer
StockTool.AI is a research and information platform. It is not a SEBI-registered investment adviser or research analyst, and nothing here constitutes investment advice or a recommendation to buy, sell or hold any security.
All insights are AI-generated from publicly available filings, transcripts, annual reports and news. They are summaries, not complete records. They are not exhaustive, and the source document always governs. Information may contain errors or omissions, and data may be delayed or incomplete.
Any investment decision you make is entirely your own. You are responsible for validating every piece of information you rely on against primary sources before acting on it. We accept no liability for any decision taken, or loss incurred, on the basis of anything published here.
Investments in securities markets are subject to market risks. Read all related documents carefully before investing.